Appropriate place for restaurant in Hong Kong
1. Introduction
1.1. Background
This is the capstone project of IBM Data Science Professional Certificate. In this project, I will use the Foursquare location data to explore neighborhoods in Hong Kong, and to come up with a problem that I can use the Foursquare location data to solve.
1.2. Problem
I will explore the neighborhoods in Hong Kong and answer the question: “Where is the appropriate place to open a new restaurant in Hong Kong”.
1.3. Interest
Hong Kong is one of the biggest international cities in the world, and one of the financial center of Asia. Opening a restaurant here is an attractive idea for any one who want to extends its business to Asia. They would be very interested in this project.
2. Data
2.1. Data Sources
My main two data sources are:
- Wikipedia[1] provides the list of districts and neighborhoods in Hong Kong
- Venues data from Foursquare[2]
The coordinates data is from https://www.maps.ie/coordinates.html.
Note: Some data may contains Chinese characters, i.e. some places’ name, though I’ve tried my best to avoid it. Please aware that it doesn’t affect the analysis and report at all.
2.2. Data Cleaning
Hong Kong consists of Hong Kong Island, the Kowloon Peninsula, the New Territories, Lantau Island, and over 200 other islands. This project will focus on Hong Kong Island and Kowloon.
First of all, I need to collect the districts and neighborhoods data from wikipedia page, and find the coordinates for every neighborhood. I did this manually and create a file named neighborhoods_hong_kong.csv.
The formatted data looks like this:
| District | Neighborhood | Latitude | Longitude |
|---|---|---|---|
| Central & Western | Central District | 22.281322 | 114.160258 |
| Central & Western | Mid-Levels | 22.282405 | 114.145809 |
| Central & Western | The Peak | 22.272003 | 114.152417 |
| Central & Western | Sai Wan | 22.285838 | 114.134023 |
| Central & Western | Sheung Wan | 22.286870 | 114.150267 |
2.3 Feature Selection
In this project, I will get data of recommended venues inside 1000 meters radius of every neighborhood, calculate the top10 most common venues by its category as features. Plus, the 11th feature is if there is a bus/metro station nearby.
| Feature Label | Type & Description |
|---|---|
| 1st Most Common Venue | str. Name of the vanue category |
| 2nd Most Common Venue | str |
| 3rd Most Common Venue | str |
| 4th Most Common Venue | str |
| 5th Most Common Venue | str |
| 6th Most Common Venue | str |
| 7th Most Common Venue | str |
| 8th Most Common Venue | str |
| 9th Most Common Venue | str |
| 10th Most Common Venue | str |
| Station | str. Yes or No |
3. Methodology
3.1. Explore Dataset
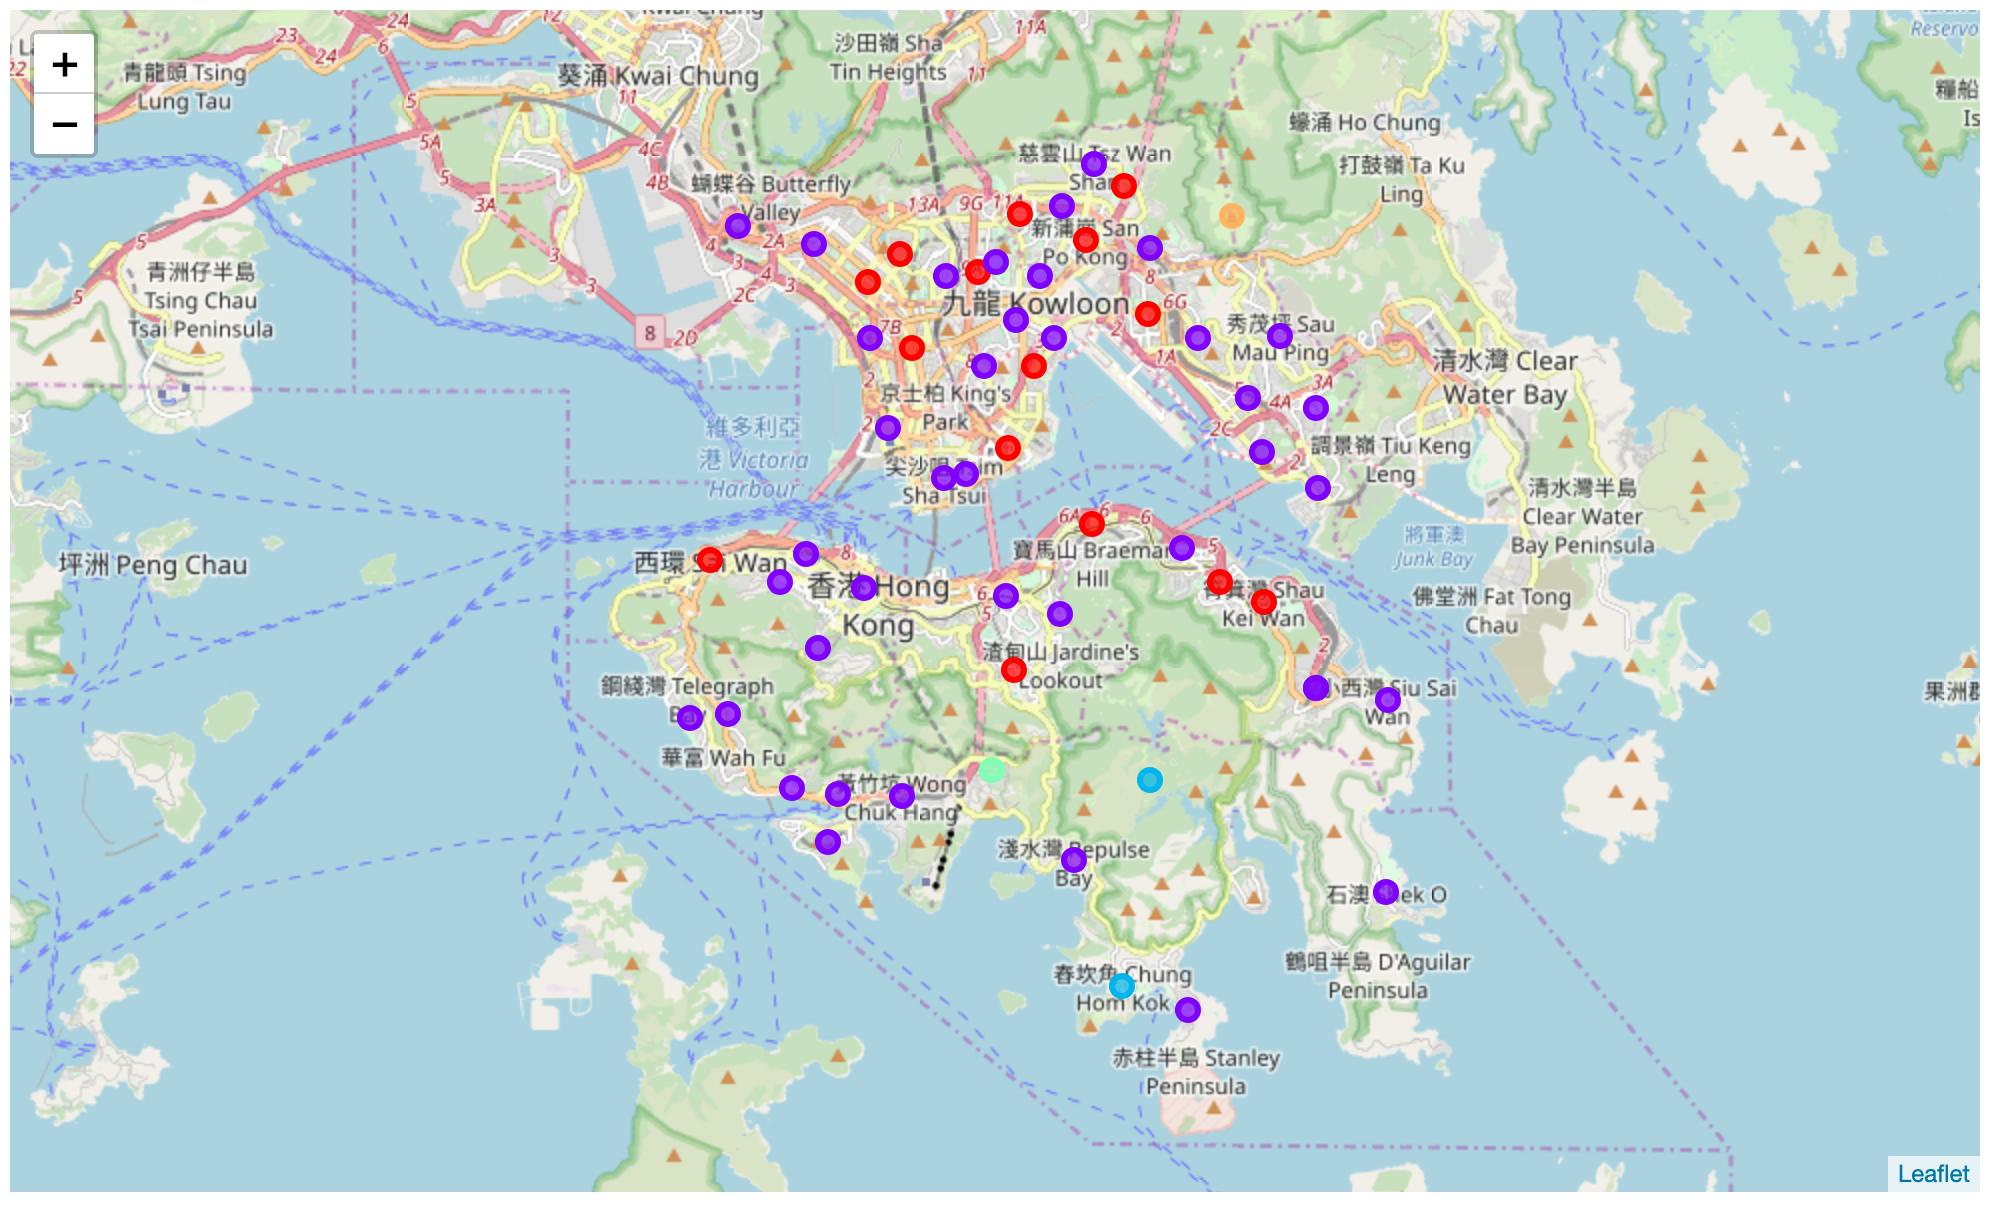
Using folium library to create map with markers to establish a global view of the dataset, and examine the accuracy of coordinates.
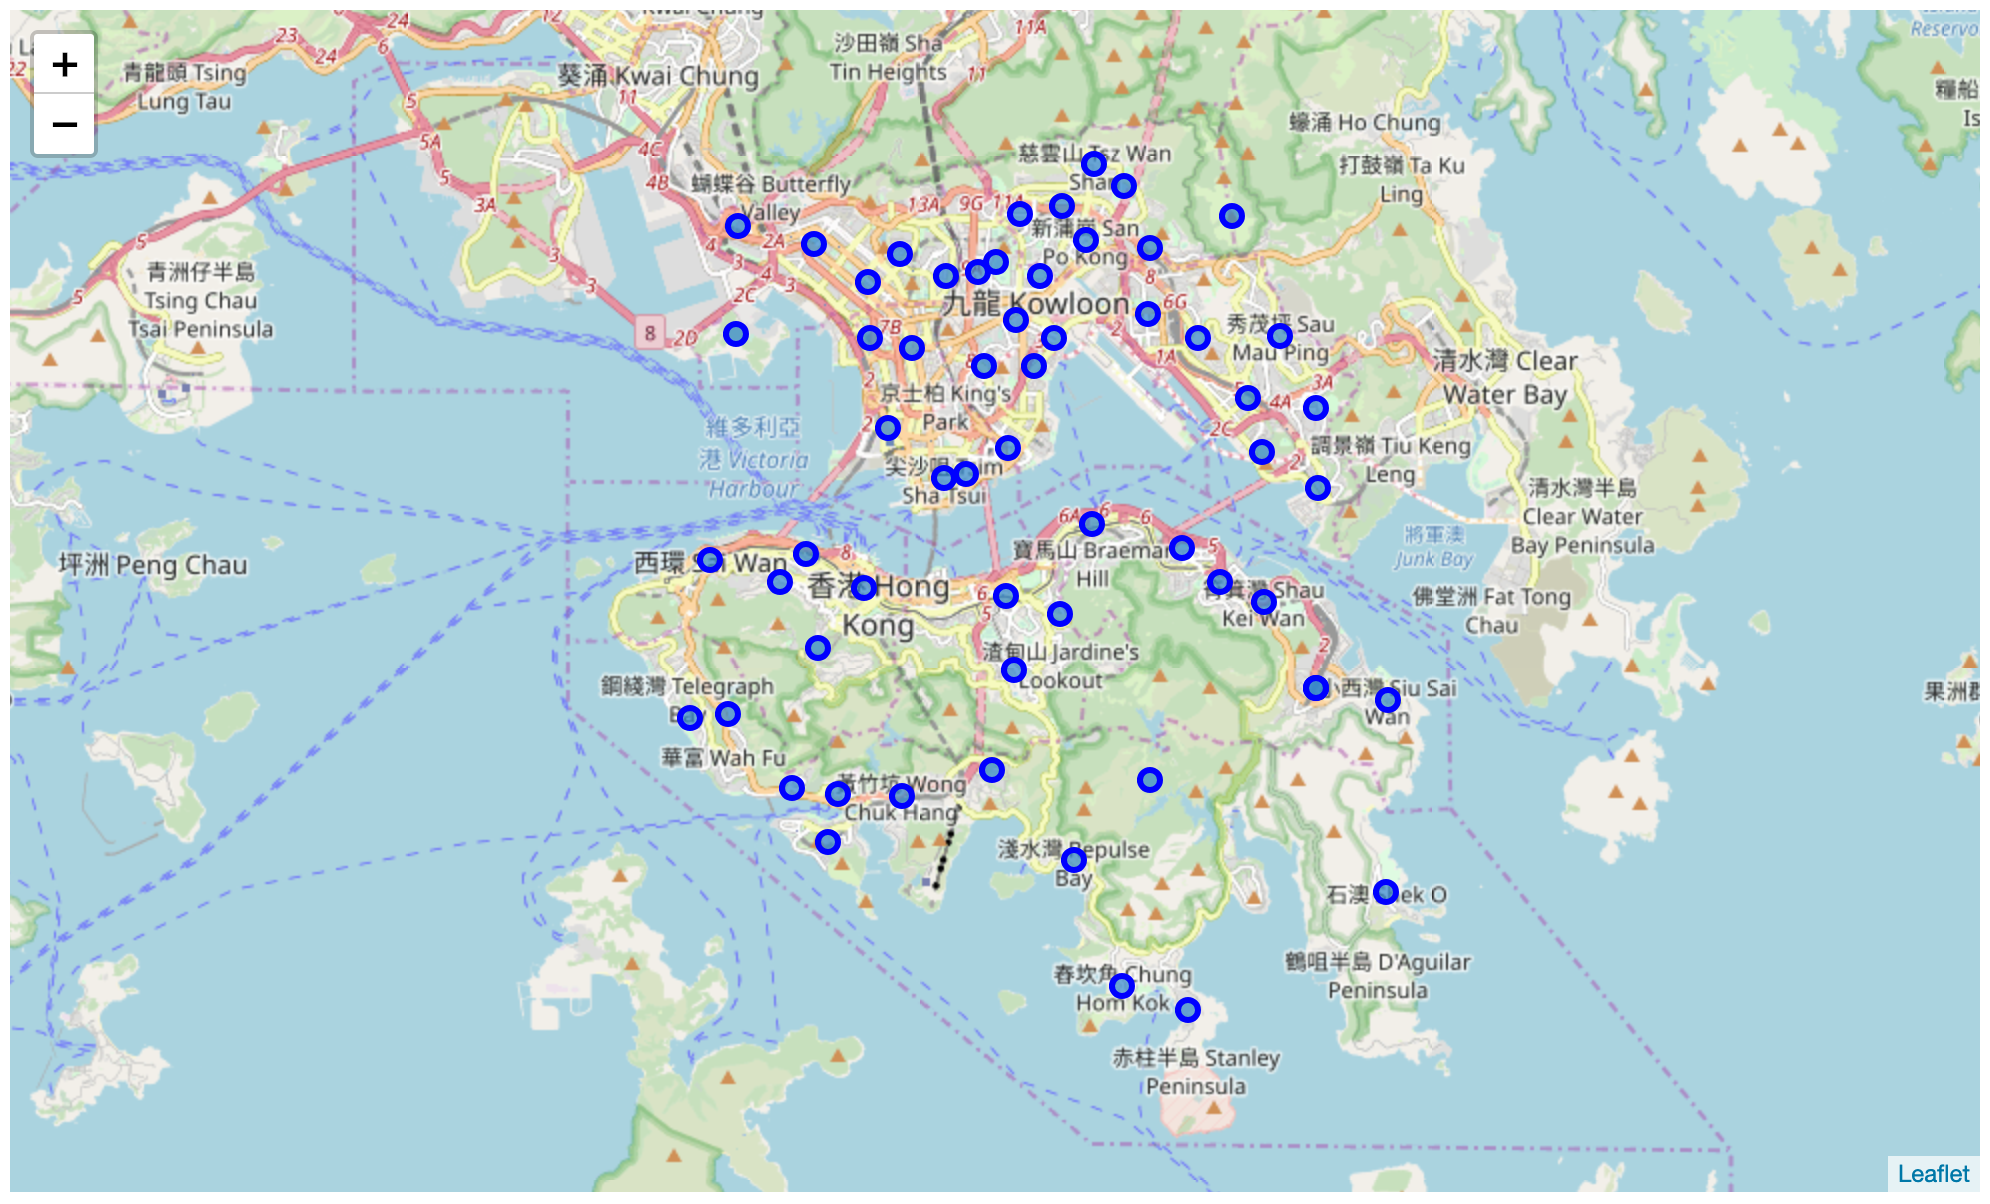
It looks like every marker is in the right place. Markers cover almost whole Hong Kong Island and Kowloon. We can identify some famous place like Tsim Sha Tsui, Central District, and Causeway Bay.
3.2. Examin Foursquare Location Date
Using Foursquare’s /venues/explore API to get recommended vanues for a specific location. To simplify the results set the limit property is 100 and radius is 1000.
This request should returns a JSON data includes up to 100 venues for a coordinate.
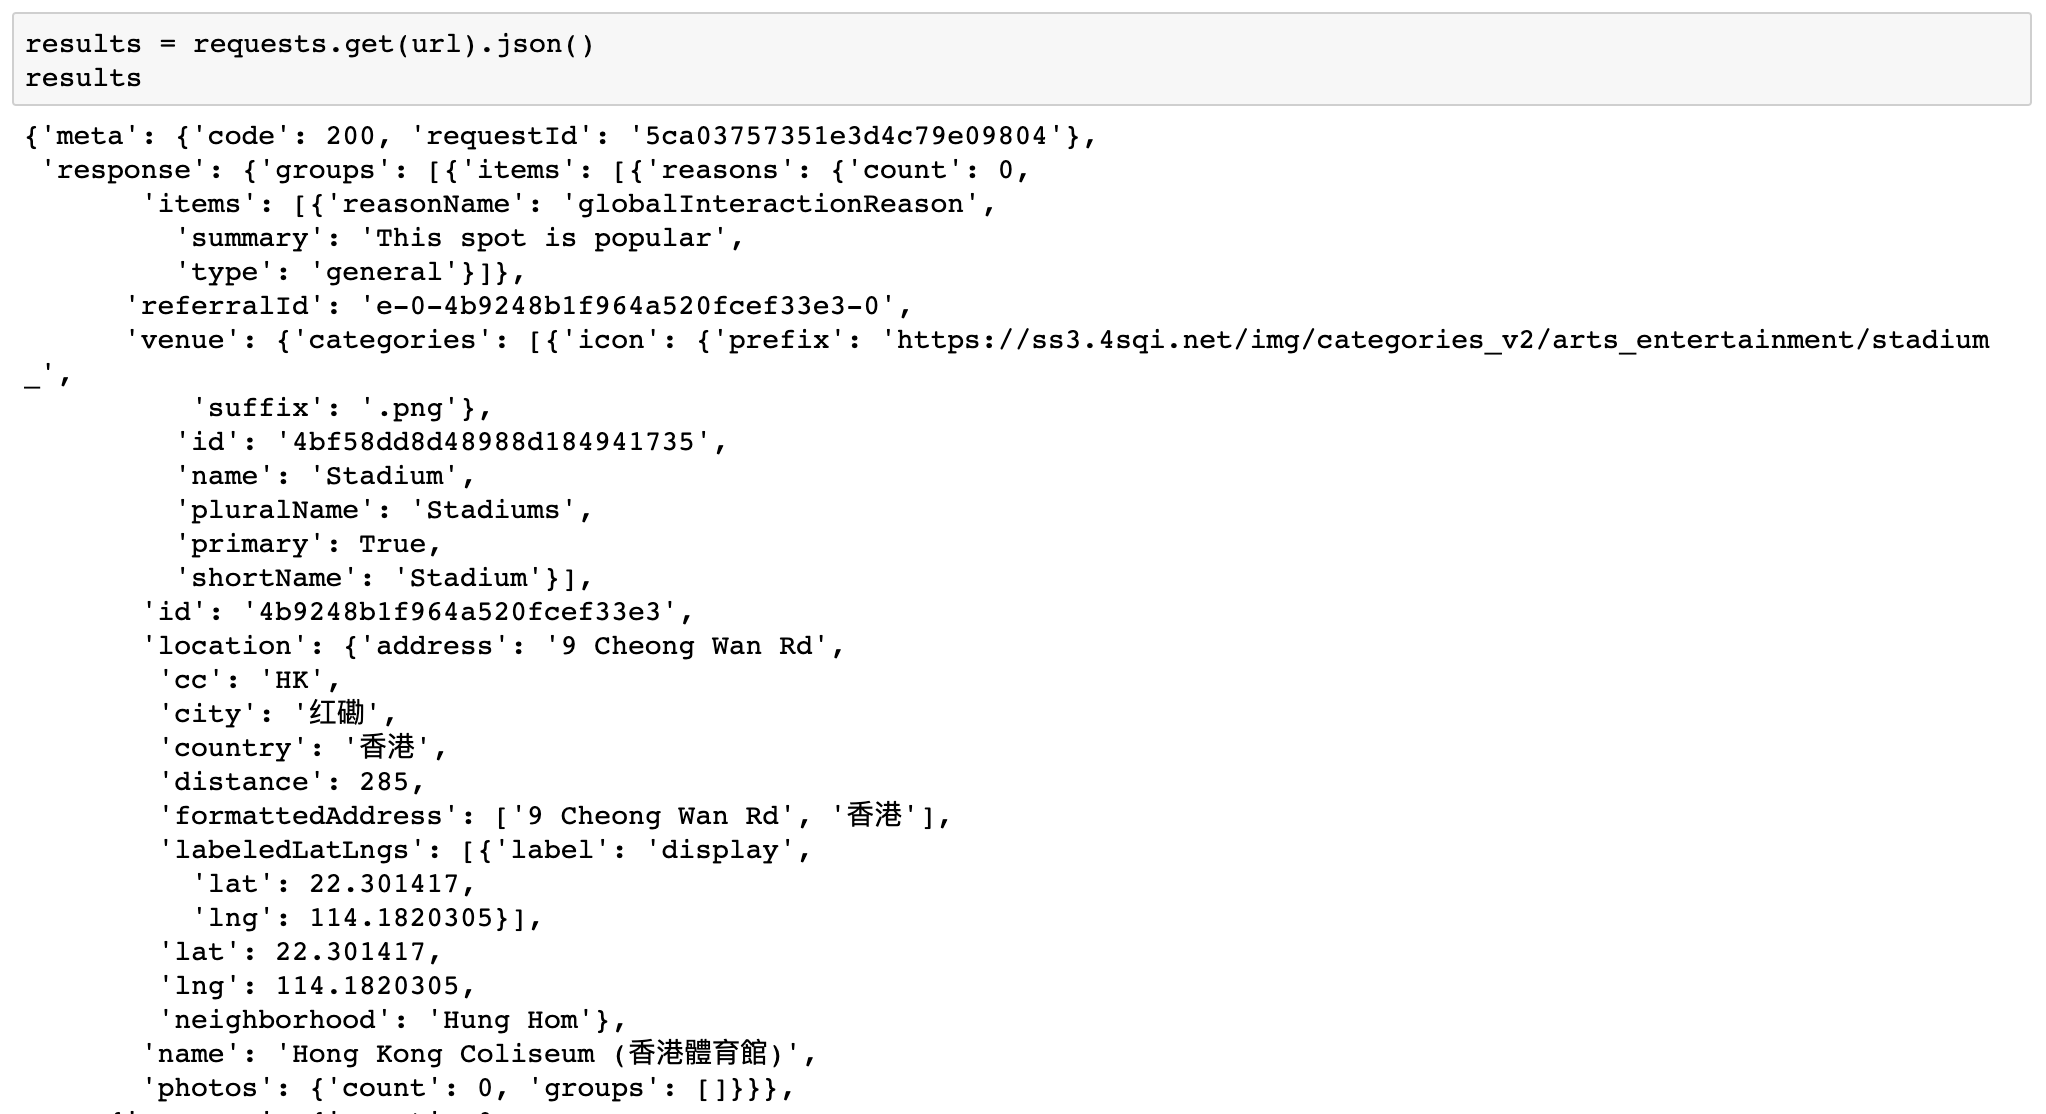
The result seems great. Next we can get venues for every neighborhoods.
3.3. Pre-processing Data
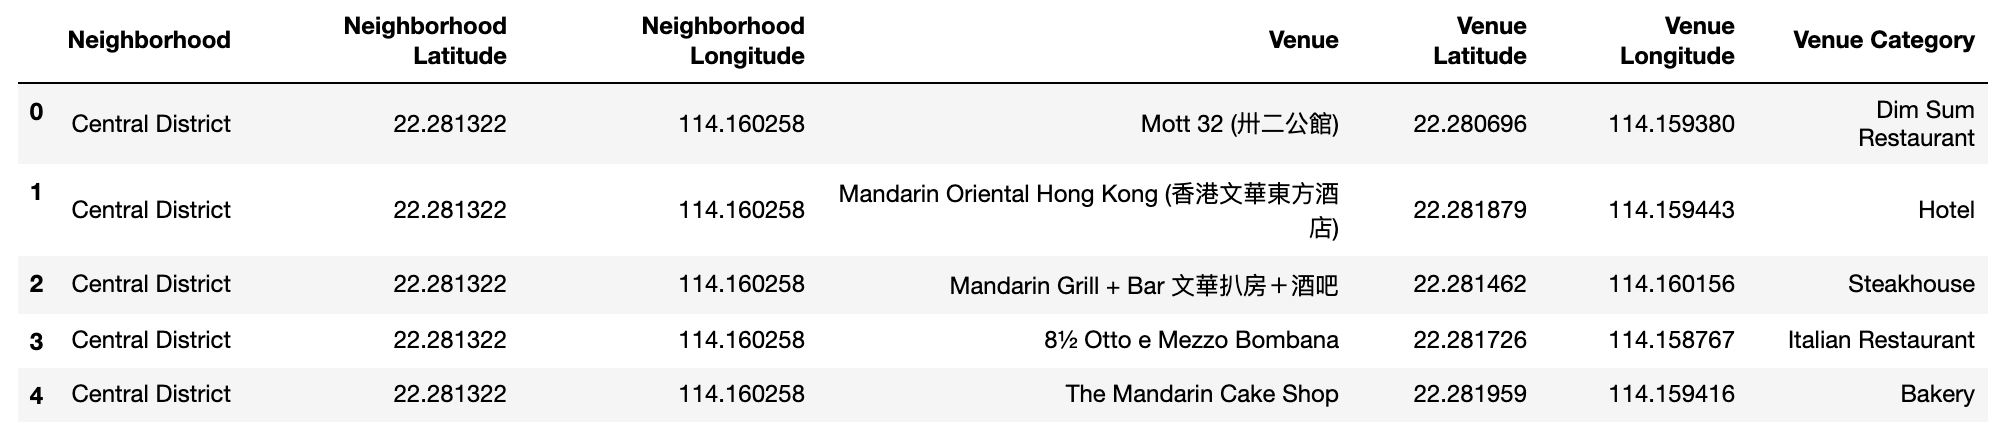
Firstly, use the venues data from Foursquare to create a DataFrame:
Then create one-hot encoding to the vanues categories, get mean of each category for every neighborhood:
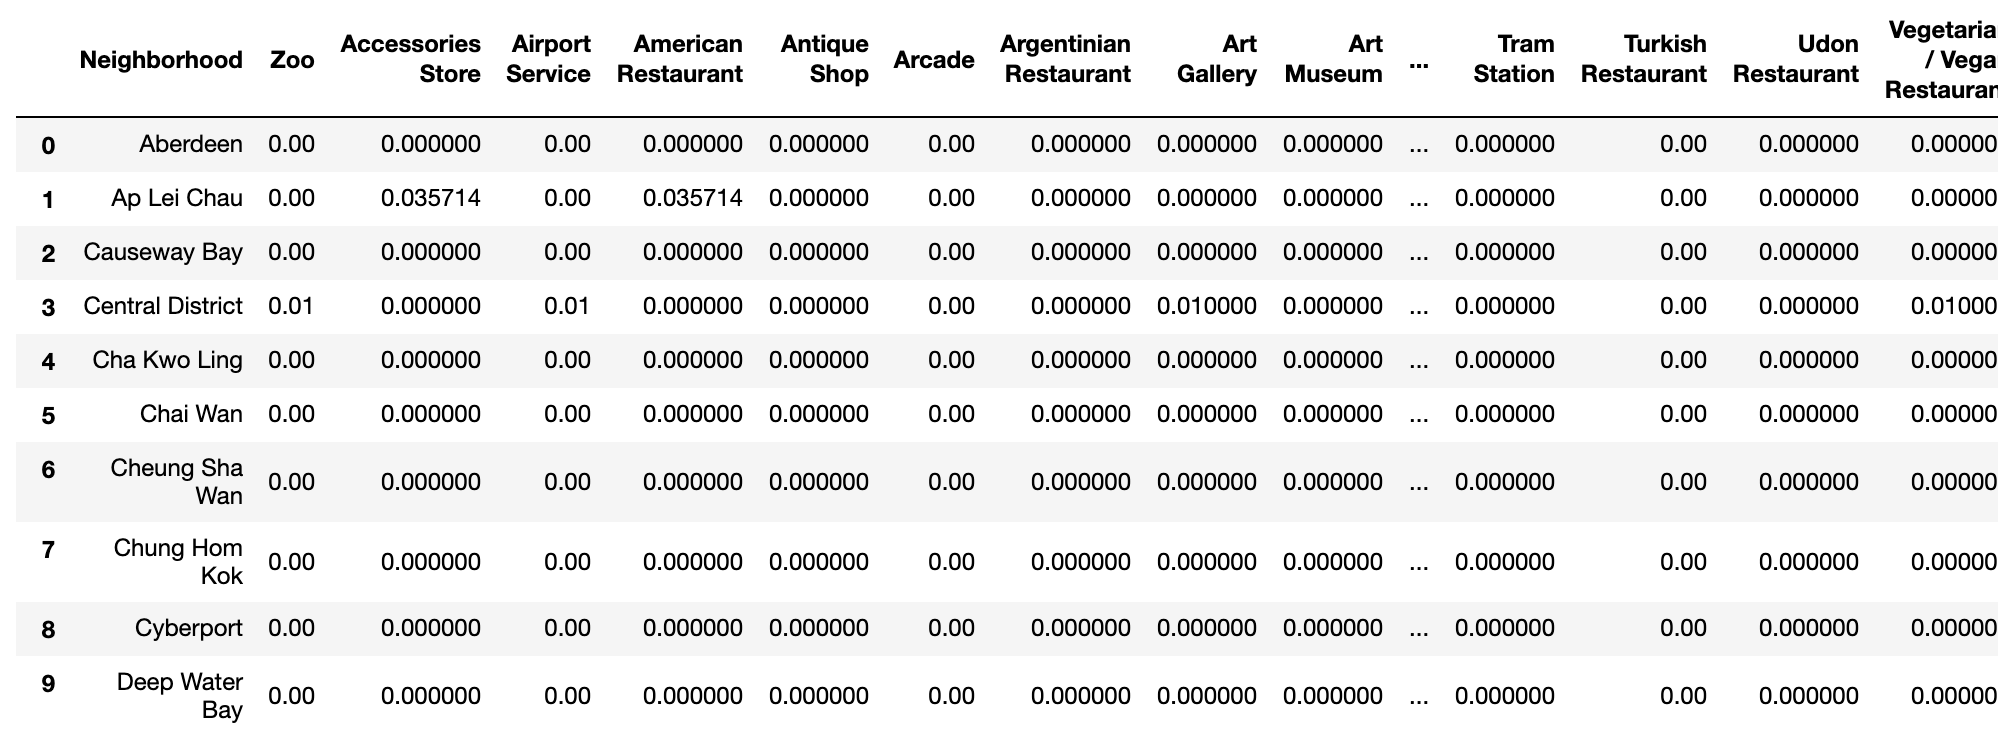
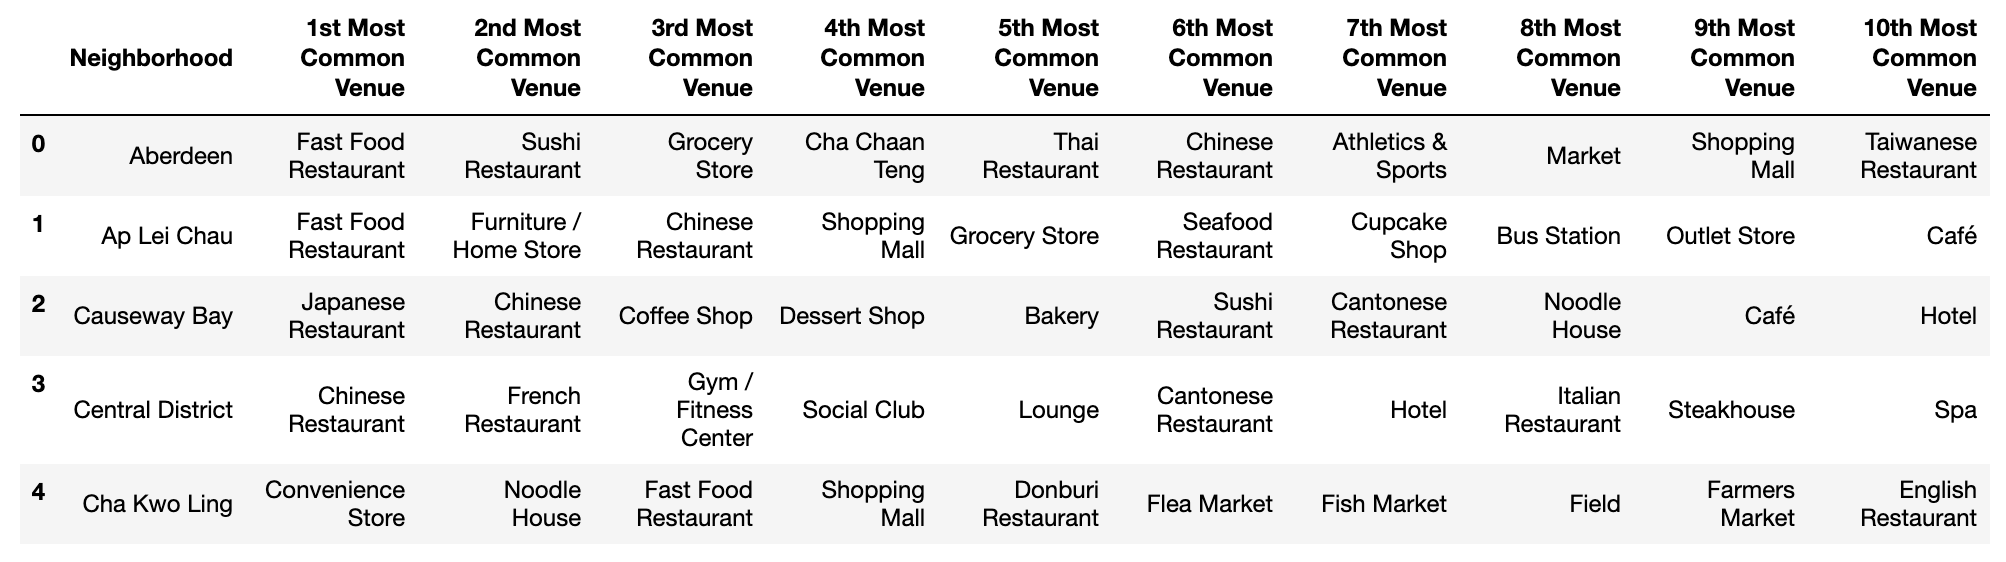
Finally calculate the frequency of categories for each neighborhood, we get the top10 most common venues for every neighborhood:
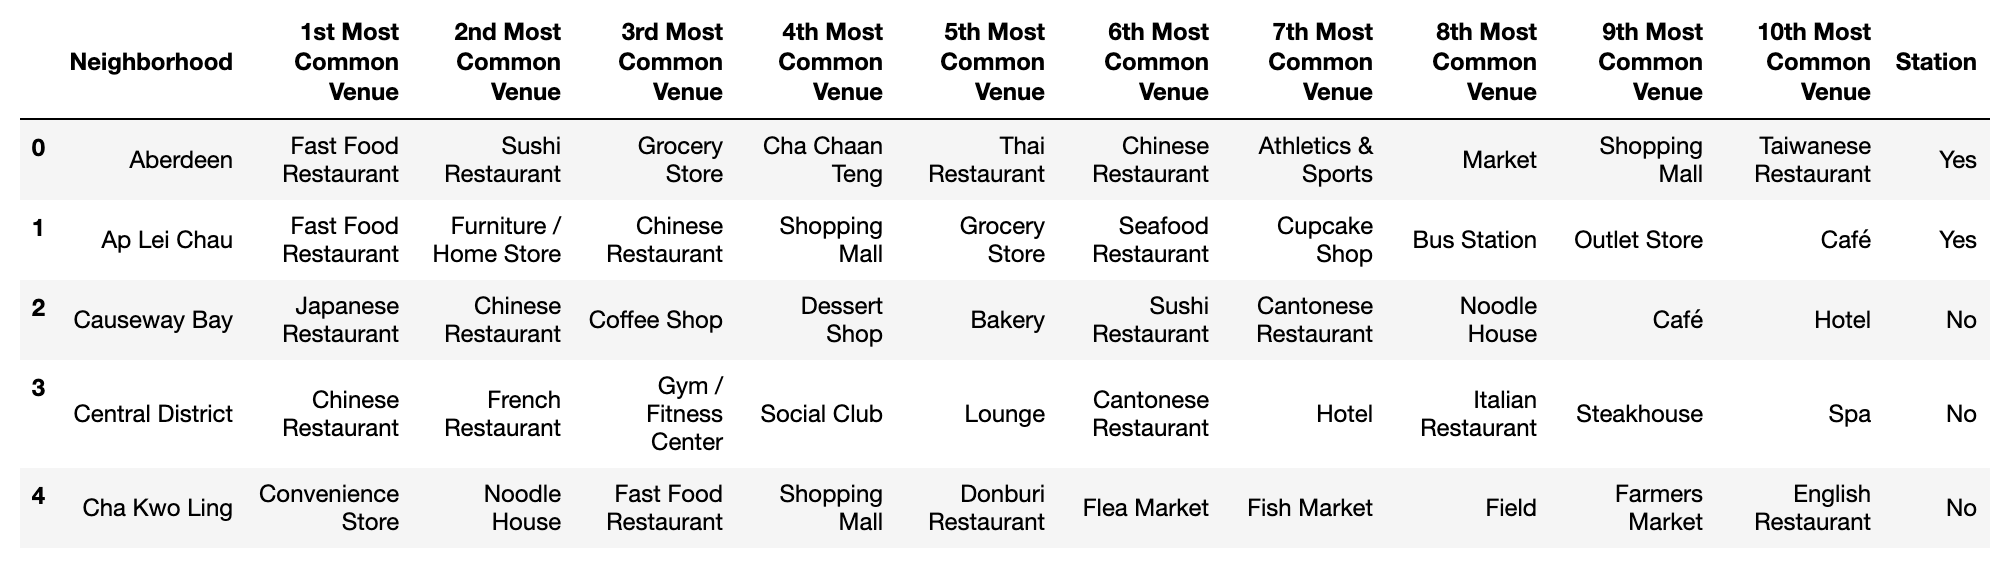
Plus, add a new column named ‘Station’ which represents if there is a bus/metro station nearby a neighborhood:
Now the pre-processing step is finished. We can run clustering on it.
3.4. Clustering
For this project, k-means is an appropriate clustering algorithm. Because we have a unlabelled dataset, so this is an unsupervisied learning project. K-means clustering aims to partition n observations into k clusters in which each observation belongs to the cluster with the nearest mean.By clustering the neighborhoods, we can find out the pattern in them, identify the identical neighborhoods and see which is our target.
One difficulty of k-means is to determine the hyperparameter k. In this project I will choose k=5, means clustering the neighborhoods into 5 clusters. k=5 is an experience hyperparameter.
4. Results
4.1. Visualize Clusters
Again, I use folium library to create a map with clustered markers:
Obviously there are two main clusters. Almost all neighborhoods in these clusters located in the urban area which makes sense. The other three clusters seems located in the mountains. They are definitely not our target.
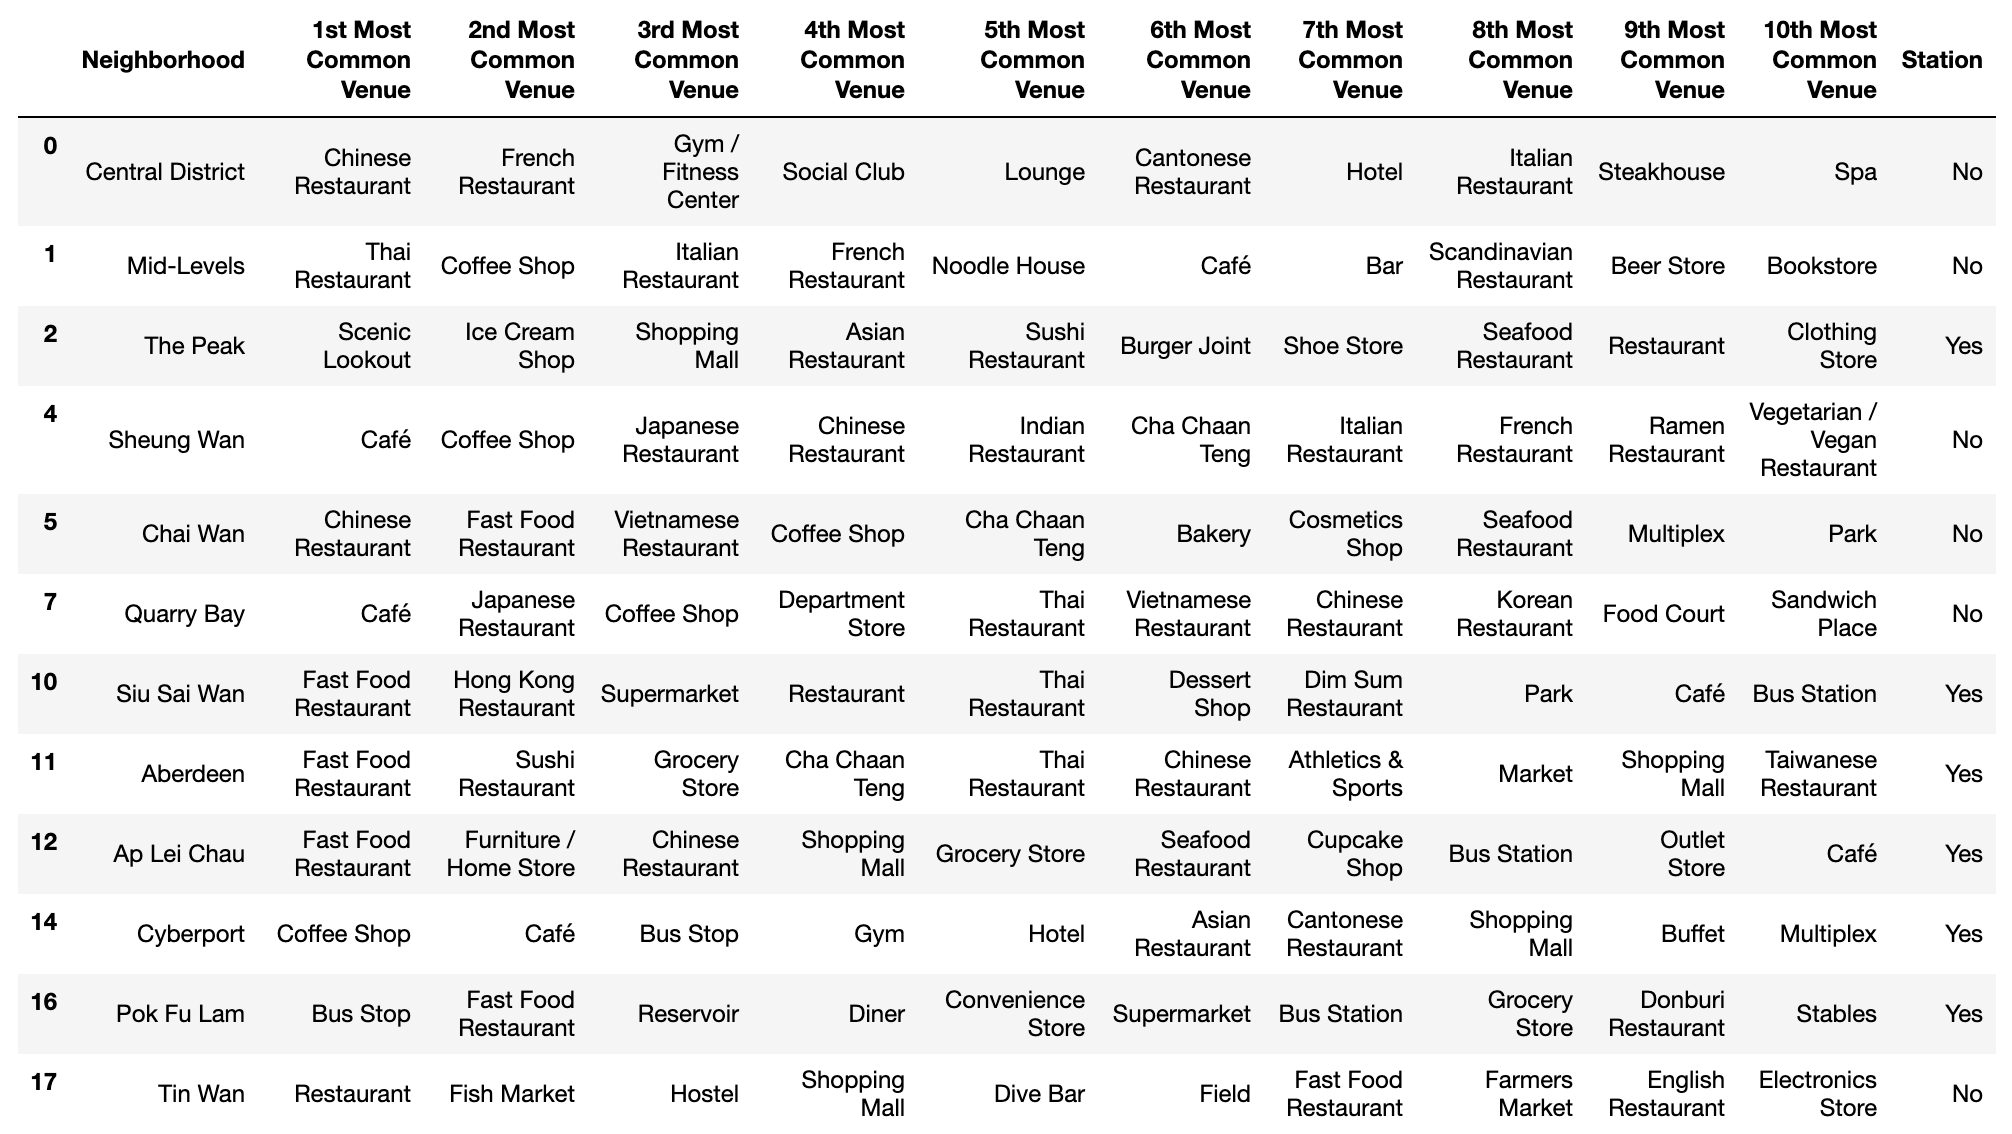
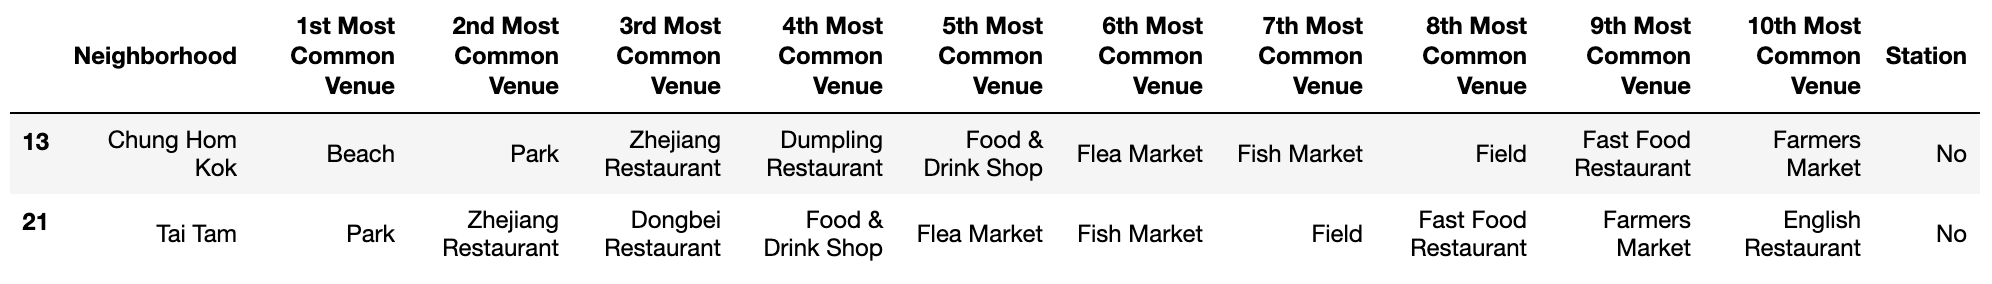
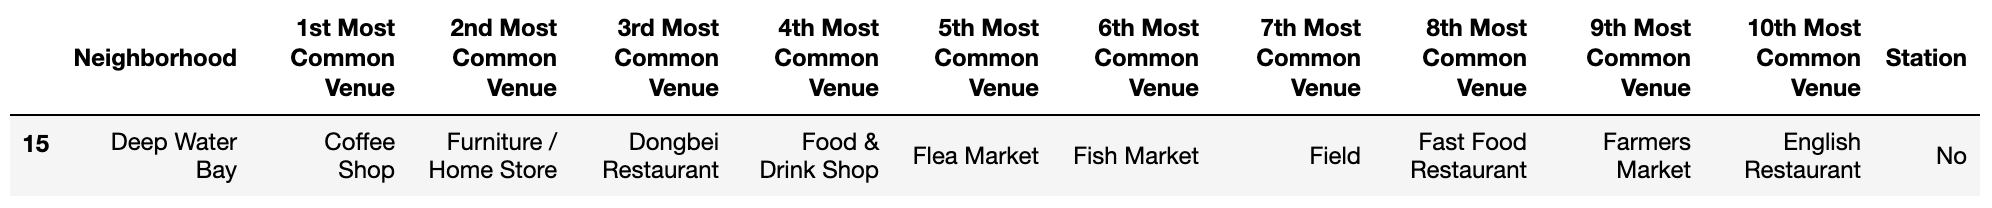
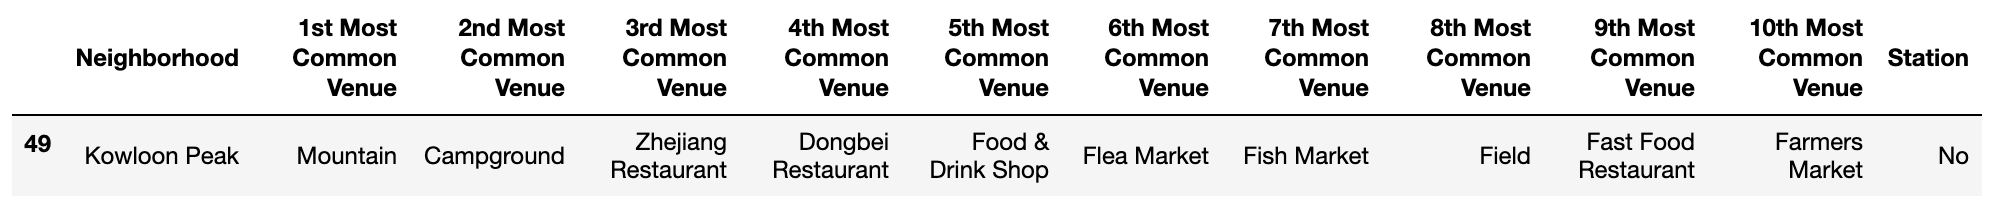
4.2. Print Clusters
Cluster 1
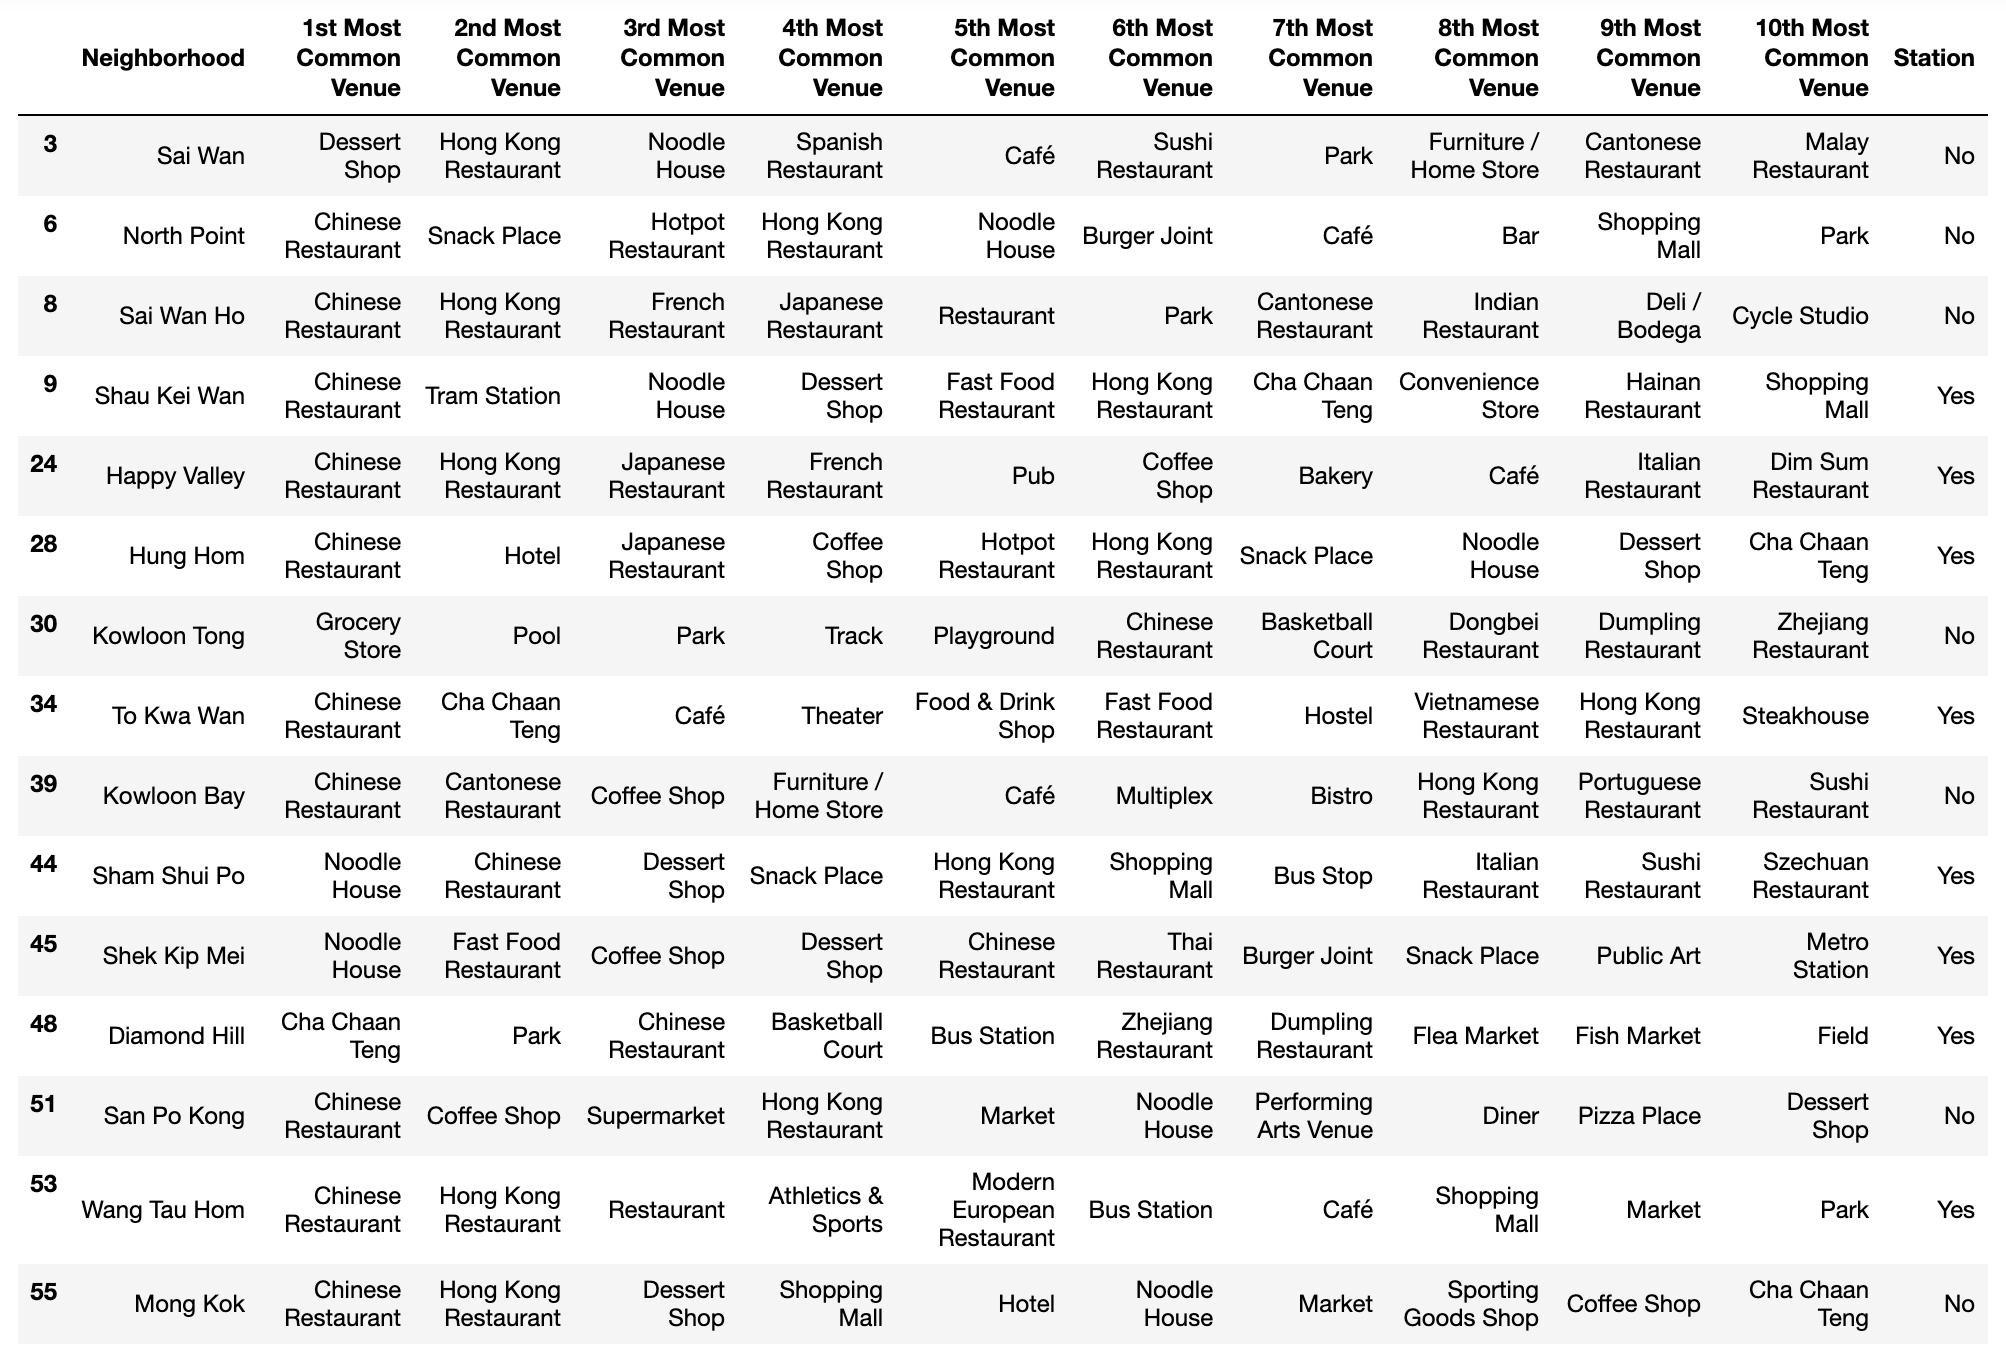
Cluster 2
Cluster 3
Cluster 4
Cluster 5
4.3. Answer the Question
By examining the clusters, I identify the cluster 1 as residential area and cluster 2 represents commercial area.
The most common venues in cluster 1 are mostly Chinese restaurant (Cha Chaan Teng and Cantonese/Hong Kong restaurant are another types of Chinese restaurant), whereas the most common venues in cluster 2 are various, including foreign restaurants, fast food restaurants, gyms, clubs, and hotels.
Our question is “Where is the appropriate place to open a new restaurant”. The answer of this question depends on what type of the restaurant is. If it’s a local restaurant, neighborhoods in cluster 1 would be good places. But for upscale restaurant, neighborhoods in cluster 2 would be better choices.
5. Discussion
For this project, k-means works properly. we use the most common venues in neighborhood and bus/metro station as features, cluster the neighborhoods into 5 clusters. The result is good for our problem.
Although the result is accurate, we can also notice that the clusters is not precise enough. Adding more features like population and average income would be helpful.
6. Conclusion
In this project, we need to use the location data from Foursquare to solve the problem “Where is the appropriate place to open a new restaurant in Hong Kong”.
I collect the neighborhoods data from wikipedia page, and format it manually. Get venues data using Foursquare’s API. One-hot encode the venues’ categories and calculate the frequencies, then get TOP10 common venues for each neighborhood plus the bus/metro station existence as features.
I use k-means algorithm to cluster the dataset into 5 clusters. I use folium library to visualize the cluster results. By examining the results, I could answer the question of this project.
In the future, more features could help to improve the model to get a better result.
7. Refereences
[1] List of places in Hong Kong
[2] Foursquare API